
*이 글을 읽기전에 작성자 개인의견이 있으니, 다른 블로그와 교차로 읽는것을 권장합니다.*
1. 따릉이 API
https://www.bikeseoul.com/app/station/getStationRealtimeStatus.do
import requests # 서버 요청
import folium # 지도
import json # json데이터 처리
import pandas as pd
import warnings # 경고처리
import folium
warnings.filterwarnings('ignore')
1-1. 데이터 요청하기
targetSite = 'https://www.bikeseoul.com/app/station/getStationRealtimeStatus.do'
request = requests.post(targetSite, data={'stationGrpSeq':'ALL'})
print(request)
print(request.text)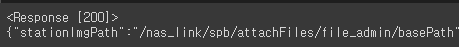

1-2. json 데이터 처리하기
json.loads(): json 타입의 문자열 데이터를 파이썬에서 처리할 수 있도록 변환(딕셔너리로 변환)
bike_json = json.loads(request.text)
print(bike_json)
print(type(bike_json))
1-3. 딕셔너리 타입의 데이터를 데이터프레임으로 변환하기
json_normalize(): 딕셔너리의 타입의 데이터를 판다스 데이터프레임으로 변환
bike_df = pd.json_normalize(bike_json, 'realtimeList')
bike_df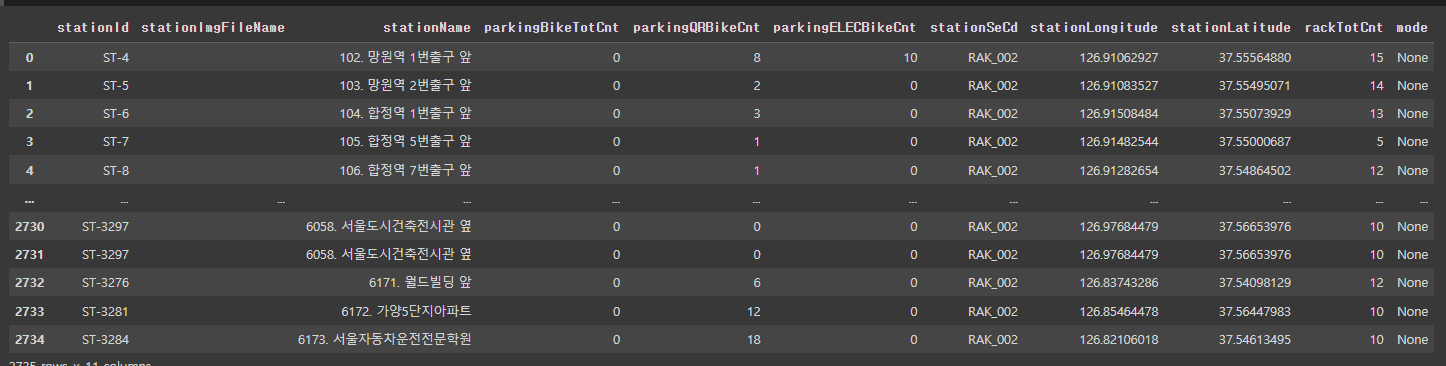
bike_df.columns
- stationName : 대여소 이름
- stationId : 고유한 대여소 번호
- stationLongitude : 대여소 경도
- stationLatitude : 대여소 위도
- rackTotCnt : 주차 가능한 전체 자전거 대수
- parkingBikeTotCnt : 주차된 따릉이 총 대수
- parkingQRBikeCnt : 주차된 따릉이 QR형 총 대수
- parkingELECBikeCnt : 주차된 새싹 따릉이 총 대수
bike_df_map = bike_df[['stationName', 'stationId', 'stationLongitude', 'stationLatitude', 'rackTotCnt', 'parkingBikeTotCnt', 'parkingQRBikeCnt', 'parkingELECBikeCnt']]
bike_df_map
# 위도, 경도 -> float변환
bike_df_map['stationLongitude'] = bike_df_map['stationLongitude'].astype(float)
bike_df_map['stationLatitude'] = bike_df_map['stationLatitude'].astype(float)
# 주차할 수 있는 자전거 갯수, 주차된 자전거 총 대수, 주차된 QR자전거 총 대수,  주차된 새싹 자전거 총 대수 -> int변환
bike_df_map['rackTotCnt'] = bike_df_map['rackTotCnt'].astype(int)
bike_df_map['parkingBikeTotCnt'] = bike_df_map['parkingBikeTotCnt'].astype(int)
bike_df_map['parkingQRBikeCnt'] = bike_df_map['parkingQRBikeCnt'].astype(int)
bike_df_map['parkingELECBikeCnt'] = bike_df_map['parkingELECBikeCnt'].astype(int)
# 파생변수 만들기[total]
# 따릉이 + QR + 새싹
bike_df_map['total'] = bike_df_map['parkingBikeTotCnt'] + bike_df_map['parkingQRBikeCnt'] + bike_df_map['parkingELECBikeCnt']
bike_df_map
# 타입확인
bike_df_map.dtypes
bike_df_map.head()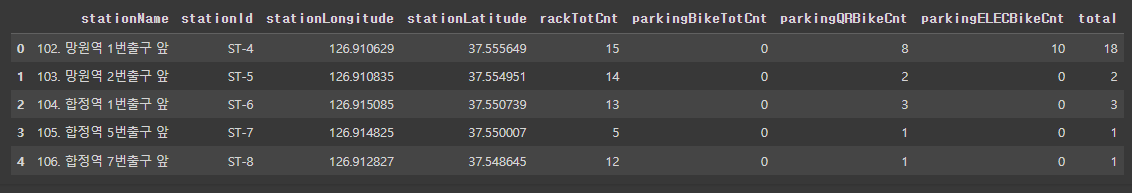
bike_df_map.shape
# {정류소명} 일반:{}대, QR:{}대, 새싹:{}대, 총:{}대

data = bike_df_map
# 대화식 지도 생성
bike_map = folium.Map(location=[data['stationLatitude'].mean(), data['stationLongitude'].mean()], zoom_start=12)

for index, data in data.iterrows():
    popup_str = '{} 일반:{}대, QR:{}대, 새싹:{}대, 총:{}대'.format(
        data['stationName'], data['parkingBikeTotCnt'], data['parkingQRBikeCnt'], data['parkingELECBikeCnt'], data['total']
    )
    popup = folium.Popup(popup_str, max_width=600)
    folium.Marker(location=[data['stationLatitude'], data['stationLongitude']],popup=popup).add_to(bike_map)

bike_map
'Python > 데이터 분석(전처리, 시각화)' 카테고리의 다른 글
| 파이썬(12)- 떡볶이 프랜차이즈 입점전략 (0) | 2024.06.03 |
|---|---|
| 파이썬(10)-Boxplot, barplot으로 데이터분석 (0) | 2024.05.29 |
| 파이썬(9)-Seaborn, Folium을 이용한 산점도, marker 시각화 (0) | 2024.05.29 |
| 파이썬(8)-Numpy와 Pandas를 이용한 데이터 전처리, 분석 (0) | 2024.05.27 |
| 파이썬(7)-matplotlib (0) | 2024.05.27 |


